

Journal of Creation 28(2):75–82, August 2014
Browse our latest digital issue Subscribe
Beneficial mutations: real or imaginary?—part 2

Part 1 dealt with R.A. Fisher’s role in founding Neo-Darwinian theory (NDT) on the idea that recessive deleterious mutations could become dominant and beneficial. Geneticists today still use his exponential distribution of fitness effects. The first experimental data to rigorously test Fisher’s theory were published in 2011 and they contradicted it. This adds to a growing consensus that the NDT is, and always was, dead. A dead theory duped us and now rules the world! The new data can be explained by recent developments in molecular systems biology: Kirschner and Gerhart’s Theory of Facilitated Variation, Eric Davidson’s Theory of Hierarchical Gene Regulatory Networks based on Boolean logic, and Peer Terborg’s Theory of Front Loaded Baranomes that come with built-in variation-inducing genetic elements. These theories are all grounded—either explicitly (Kirschner-Gerhart, Terborg) or implicitly (Davidson)—on modular variation-inducing mechanisms having been built in to the original kinds of life. Beneficial mutations are real but they produce nothing new, only triggering into action the built-in modes of variation. The idea that random DNA copying errors could produce novelties which natural selection could then harvest to explain all life on Earth is just a Darwin dream. The reality is looking ever more like Genesis 1–11!
Part 1 of this article1 covered some of the history of the ‘beneficial mutation’ concept, including its absence from recent large-scale human genome studies. Without dominant beneficial mutations to produce novelties, Neo-Darwinian theory (NDT) is dead. Recessive beneficial mutations are not up to the job. J.B.S. Haldane calculated, in 1927, that if a recessive beneficial mutation did turn up it would have to repeatedly turn up about 500 times over before it could spread widely enough to become fixed in a population by natural selection.2 Only dominant beneficial mutations could overcome this selection problem.
In 1930 the best data available on mutations was a list of 500 recorded in the fruit fly Drosophila. All of them were recessive and deleterious, and the ‘novelties’ often monstrous. To save Darwinism from oblivion, English statistician (and ardent eugenicist) R.A. Fisher chose to make a series of assumptions by which deleterious recessive mutations could “become” beneficial and dominant.3 His resulting exponential distribution of fitness effects continued to be used by geneticists throughout the 20th century. A 2010 review lamented that “we still lack sufficient data to draw confident conclusions about the distribution of effects or the dominance of beneficial mutations”. A year later, however, the first adequate data set did finally appear. But it contradicted Fisher, and confounded its authors.4
We can now see that the NDT is, and always has been, a dead theory because its foundation in genetics never existed. This is not an isolated conclusion. Creationists ReMine,5 Sanford6 and Williams7 have documented numerous other fatal flaws in the theory. In July 2013, Oxford Emeritus Professor of Physiology Denis Noble announced that “all the central assumptions of the Modern Synthesis (often also called Neo-Darwinism) have been disproven”.8
What are ‘beneficial mutations’?
The nature of mutations and their contribution to the history of life has been thoroughly discussed in creationist literature.5,9,10,11,12 The general conclusion is typified by this quote from plant geneticist John Sanford:
“Everything about the true distribution of mutations argues against their possible role in forward evolution [emphasis in original]” (p. 25).6
In contradiction to the NDT, Sanford showed that our genomes suffer from ‘genetic entropy’—sub-lethal deleterious mutations accumulate unstoppably, driving us to imminent extinction. Evolutionists have cited a number of mutations that can be beneficial in some populations under some circumstances.13,14 Creationists have examined these cases15 and agree that some are credible, but others are equivocal (with potential for advantage or disadvantage) and most involve a loss of genetic information, consistent with Sanford’s theory (and contrary to the NDT). However, none of these examples is ever used by genetic theorists because they need large data sets that show the fitness-effects of both large and small genetic changes.

For the purpose of this present article Fisher’s most important assumption was that only the smallest mutations were likely to become beneficial.16 Those with progressively larger effects would be progressively less likely to become beneficial. He illustrated this assumption in his figure 3, reproduced here in figure 1. The dashed line in figure 1 describes an ‘exponential’ curve. Fisher expected that most beneficial mutations would have only a small effect and thus arise from near zero on the horizontal scale. He needed lots of beneficial changes to make his theory work so their maximum frequency would also be near zero, followed by decreasing frequencies of mutations having larger effects. To test Fisher’s theory, geneticists required a distribution of mutation frequencies ranging from small to large effects. None of the examples cited earlier meet this criterion, nor has any of the recent large-scale sequencing of human genomes, as cited in Part 1.1 A recent ‘designer baby’ patent is of no help either, as it mostly concerns minimizing disease risk. The only potential positives were lactose tolerance and muscle performance (sprint vs endurance).17 Neither provides a test for Fisher’s theory.
Geneticists have another requirement for suitable data. They need large samples of beneficial mutations before selection goes to work on them, not afterwards, as in all the examples cited above. A 2006 study attempting to achieve this in bacterial experiments declared that “the distribution of fitness effects among beneficial mutations is indistinguishable from … an approximately exponential distribution with many mutations of small effect and few of large effect.”18 Fisher’s theory appeared to be confirmed. However, a 2009 study achieved a slightly more discriminating outcome:
“Consistent with [Fisher’s] theory, the effects of beneficial mutations are exponentially distributed where the fitness of the wild type is moderate to high. However, when the fitness of the wild type is low, the data no longer follow an exponential distribution, because many beneficial mutations have large effects on fitness. There is no existing population genetic theory to explain this bias towards mutations of large effects [emphasis added].”19
The first experiments to completely solve the selection problem were published in 2011, and the results are shown in figure 2. Instead of fitting Fisher’s one-tailed exponential distribution, it produced a two-tailed Normal distribution.4 This result was so “curious” it made the authors declare that their experiments were “not a test of existing [i.e. Fisher] theory”. But “even in the absence of [a new] theory our detailed understanding of the genotype-to-phenotype map underpinning [the beneficial mutations] ought to be sufficient to attempt an explanation for the observed normal distribution.” However, after applying their “detailed understanding”, they had to admit “just why the [mutations] should conform to a normal distribution is not clear”.
Deleterious and beneficial mutations compared
Now that we have some ‘hard data’ on beneficial mutations that contradict Fisher’s exponential distribution, it is worth seeking out some equally ‘hard data’ on deleterious mutations to compare it with. This is especially important in light of the fact that genetic theorizing on this subject throughout the 20th century was based upon assumptions, not data. For example, Motoo Kimura’s ‘Neutral Theory of Molecular Evolution’ is founded upon the principle that natural selection is unable to detect the effects of the majority of mutations.20 His theory is therefore based primarily upon ignorance of genetic consequences, which is the antithesis of what is needed here. As it turns out this is a fundamental problem in all kinds of mutation research. It is extremely difficult to experimentally validate cause–effect relationships between genetic change and phenotypic consequences. The problem is so great that most researchers don’t even bother trying. They just do computer-generated ‘genome wide association studies’ (GWAS)21 and then speculate about causes and effects.
Deleterious mutations should follow Fisher’s exponential curve since we could expect that single nucleotide variations would, like rust in a machine, only gradually cause deterioration in an organism’s function. According to a model developed by physicist and information theorist Hubert Yockey, proteins should tolerate numerous substitutions between amino acids having similar properties before the function of the whole molecule is impaired.22 That is, mutations in protein-coding regions should only produce a gradual diminution of fitness as mutation load increases, as Fisher predicted. It seems, however, that Fisher and Yockey were both wrong.

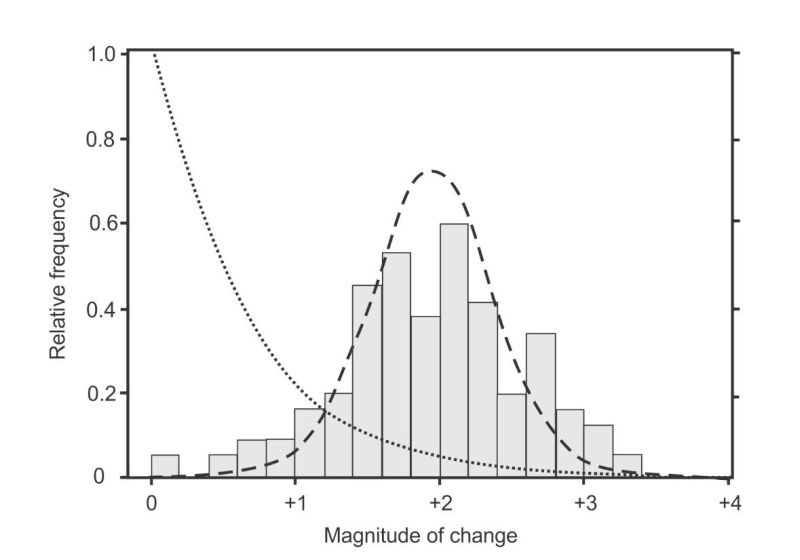
Results from the largest study of the effects of amino acid-changing mutations in human genomes, corrected for the effects of selection,23 are plotted in figure 3 alongside the beneficial mutations from figure 2. The data looks nothing like Fisher’s exponential distribution (dotted line on left), but fits well to a Gamma distribution as illustrated by the dashed line. This curve was constrained to pass through zero frequency at zero effect to illustrate one of several models tested by the authors where deleterious mutations belong to a different class to neutral mutations.24 It was also constrained to pass through zero frequency, on the far left, where deleterious mutations become lethal.
Fisher’s expected exponential curves are shown the same size for both effects because he assumed that both occurred with equal frequency (in contradiction to his data).25 His curves are nothing like either of the distributions displayed here. These two data sets clearly describe two quite different classes of biological events.
The comparisons in figure 3 need some refinement to correct for Fisher’s false assumption that beneficial and deleterious mutations occur with equal frequency. Today we know that beneficial mutations are very rare. If a modern geneticist were to correct Fisher’s erroneous assumption (as Sanford6 did in his figure 3d), then the result might look something like figure 4.

The curve in figure 4 now has a strange shape but this is not a problem because statistical distributions come in many different shapes and sizes. The important point in figure 4 is that geneticists ever since Fisher had expected beneficial mutations to be nothing more than the right-hand tail of the fitness-effects distribution of all mutations. They only had one mechanism for generating novelties via beneficial mutations—random DNA copying errors (see part 1)—and it was the same mechanism that generated deleterious mutations. The expected distribution would have a maximum value at, or near, zero, with diminishing tails on either side tracing out exponential curves.26 The maximum value near zero means small changes with little or no effect are the most frequent for both kinds, with larger changes in both directions becoming increasingly rare.
Geneticists did not expect beneficial mutations (or deleterious mutations) to produce free-standing two-tailed distributions with maximum values far removed from zero fitness-effect. That would mean beneficial mutations arise from a different class of process to that which produces deleterious mutations. And that is why the new beneficial data caused such consternation—because they had no theory to explain it. But creationists can explain it through a combination of statistics and recent developments in molecular systems biology.
Molecular systems biology
Fisher’s theory was built upon his gene-centred view of heredity, which originated with Mendel and the early geneticists. In modern DNA terms we now know that the smallest possible mutation is just a single nucleotide change. For a bacterium that would amount to a difference of about 0.0001% (1 change in a 1-million-nucleotide genome), and for a human it would be a difference of about 0.00000003% (1 change in a 3-billion-nucleotide genome). Such tiny changes are most likely to be quite insignificant in their effect on the organism.27 We also know from genome sequencing that single-nucleotide changes are the most common. The 1,000 Genomes Project quoted in Part 1 located 38 million single-nucleotide changes, 1.4 million indels (a difference of 1–50 nucleotides resulting from insertions and/or deletions), and 14,000 large deletions (>50 nucleotides). These results follow Fisher’s expectation—small changes are most common, while larger changes become increasingly rare. Fisher also assumed that the amount of damage done by a mutation would be proportional to the size of the change (in today’s parlance, the number of nucleotides involved) resulting in a similar exponentially decreasing curve. Neither data set in figure 3 matches this pattern so something else must be going on.
When physiologist Denis Noble announced the demise of the NDT in 2013, he argued for a new view of life based on cells, with the genome just being an organ within the cell.8 Molecular systems biology28 and evolutionary developmental biology (evodevo)29 are the central disciplines in building this new view of life. In a pioneering 1997 book Cells, Embryos, and Evolution: Toward a cellular and developmental understanding of phenotypic variation and evolutionary adaptability, Berkeley Professor John Gerhart and Harvard Professor Marc Kirschner outlined an evolutionary paradox that molecular biology had uncovered. On one side there is extraordinary conservation of molecular structure and function in the core processes of life. All prokaryote cells have similar structure and metabolic functions.
All eukaryote cells have similar structure and metabolic functions (prior to specialization).
All multi-cellular animals use the same junctions and extracellular matrix. Metabolic processes are so highly conserved that a human insulin gene can be inserted into a bacterium or yeast genome and exactly human insulin is produced. Body plans remain exactly the same across entire phyla. On the other side there is extraordinary diversity in the anatomy, physiology, and behavioural strategies among individual species. How can so many things that remain the same produce so many ways of being different? Kirschner and Gerhart failed to solve the paradox in 1997 but they did succeed in identifying this as a severe problem for evolutionary biologists. The NDT depends entirely upon random DNA copying errors for producing novelty, so they had expected to find random changes in everything. Something was clearly wrong!
In 2005 Kirschner and Gerhart succeeded in what they claimed to be the first comprehensive theory of how life works at the molecular level: facilitated variation theory. Reviewed previously in this journal,30,31 it was received favourably32,33 by the National Academy of Sciences,34 and has received support from a computer modelling study.35 They identified ‘weak regulatory linkage’ between ‘modular conserved core processes’ as the solution to the paradox. They compared the modular components to Lego blocks—individually hard to break (conserved), but easy to pull apart and rearrange (weakly linked) to make different kinds, sizes, and shapes of organs and organisms. Furthermore, they claimed that adaptability, and thus ‘evolvability’ is built in. Genetic variation and mutations do not have to be creative; they only need to trigger the creativity built in to the organism.36 This claim is a staggering refutation of Darwinism, but the authors failed to acknowledge it.37 One consequence is that uniquely beneficial mutations are no longer required because all the potential for variation in any particular lineage is already built in, just waiting to be expressed through a genetic change. One achievement of their theory is that it provides a mechanism whereby deleterious mutations can have beneficial outcomes. Had Fisher’s dream come true? Kirschner and Gerhart cited the mechanisms underlying beak variations in Darwin’s Galápagos finches as support for their theory. The NDT would require a long sequence of mutations occurring independently in the upper and lower beak and the adjacent craniofacial system, plus many generations of selection to slowly produce gradual morphological and functional changes. But research has shown that only two modular regulatory changes are needed to explain the observed natural variation.
The bone morphology protein BMP4 when expressed earlier or later in embryogenesis causes broad or narrow beak development, and more or less of the calcium regulator protein calmodulin produces long or short beaks. These modifications occur via changes in regulatory systems that do not otherwise interfere with the machinery that builds the craniofacial features.38 Field observations confirm that beak size and shape varies as climate and food availability varies.39
Kirschner and Gerhart did not speculate on the shape of the fitness-effects distribution of mutations that their theory predicts. However, if we insert into their framework Peer Terborg’s Theory of Front Loaded Baranomes that come with built-in variation-inducing genetic elements (VIGEs),40 together with recent insights into gene regulation networks, then creationists can make such predictions.
The regulatory genome
The protein-coding system in DNA only accounts for about 1.5% of the human genome. Recent ENCODE reports show that the other 98.5% is “full of functional elements”41 and it is “pervasively transcribed”.42 The investigators said that RNA, rather than DNA, should now be identified as the carrier of inheritance, and the concept of a ‘gene’ needs to be revised to take into account all the regulatory interactions up to and including the appearance of the phenotype that it produces.43 This statement heralds a huge revolution in biological thinking—extricating it from the gene-centric paradigm and placing it squarely into the cell/organism paradigm that Noble called for.
The vast number of RNAs transcribed from the non-coding DNA are largely confined to the nucleus, where they work on gene regulation.43 This is where the real business of life is carried out. The regulatory genome, as it is now known, consists of a complex array of Gene Regulatory Networks (GRNs) in combinations unique to each species. “GRNs are composed of multiple sub-circuits, that is, the individual regulatory tasks into which a process can be parsed are each accomplished by a given GRN subcircuit.”44 That means GRNs are ‘modules’ as defined by Kirschner and Gerhart. GRNs use Boolean logic circuits (AND, OR, and NOT operators) to process biological data at their ‘cis-regulatory’ nodes in an exactly comparable manner to that in modern computers.45 From these basic Boolean operations even the most complex switching patterns can be produced. Human genomes contain about 8 million such regulatory nodes,46 so working out the circuit diagrams for producing a human—and identifying the differences between humans and chimpanzees—will be a huge enterprise. No-one is even doing the necessary research to find out because experiments on human and chimp embryos are banned.
The idea that genes might be regulated by logic circuits originated in 1969 with Manhattan Project physicist Roy Britten and developmental biologist Eric Davidson.47 They spent the rest of their careers studying the GRNs in the purple sea urchin Strongylocentrotus purpuratus. They looked for switching sites on DNA upstream of the genes they control, measured the time course of RNAs produced from these sites, and then compared them with developmental stages in the early embryo. They now have the circuit diagrams of the GRN that turns DNA into the early embryo.48
In 2006 Davidson wrote the first textbook on this subject.49 It showed that GRNs operate under three levels of hierarchical control. At the top level are the body plan controls which tolerate no change (mutants die). Second-tier controls develop the organ and appendage systems within the body plan and are highly conserved (some change may rarely be tolerated). But third-level controls tolerate possibly endless change, and this is where Davidson believes that most species and genus-level variation takes place. This dramatically changes the fitness-effects landscape for mutations because their effects will depend upon the level of the GRN hierarchy in which they occur.50 The invariance of body plans across phyla poses a severe challenge to evolution:
“A strong conclusion is that the evolutionary process generating the … basic eumetazoan body plans was in many ways very different from the evolutionary changes that can be observed at the species level in modern animals [emphasis added].” 51
In 2011 Davidson won the International Prize for Biology for his work.
Integrating molecular biology and statistics
We can now attempt an explanation as to why beneficial mutations fit a Normal distribution, why deleterious mutations fit a Gamma distribution, and why neither of these fit Fisher’s exponential distribution. Fisher’s exponential distribution is fully understandable within his gene-centred view of life, as outlined earlier, and it does not explain the data in figure 3. His idea that deleterious mutations could become beneficial does appear to be justified under Kirschner-Gerhart theory, but their mechanism is so radically different that it constitutes a clear repudiation of Fisher’s mechanism. Beneficial mutations that follow a Normal distribution can be explained by the modular structure of life at the molecular level. Modularity is recognized as fundamental in Kirschner and Gerhart’s Lego block metaphor, in Davidson’s hierarchical Boolean gene regulatory circuits, and in Terborg’s VIGEs. Contrary to Fisher, none of these authors describes a major role for single-nucleotide variations (SNVs) to play in the history of life. Genetic information does not lie in the accumulation of SNVs over time (as the NDT assumes); it lies in genetic information systems, which always come in modular form.52
Virtually everything inside a cell is modular because it consists of large macro-molecules, either alone or in combination with one or many others, to create intracellular machines. Proteins are also modular in structure, with different modules doing different things, and each one usually doing the same thing in different proteins. Genes—in their textbook representation—are modular, consisting of several distinct exon and intron segments. Boolean logic points to discrete (lumpy, jumpy, or stepwise structure) rather than continuous (smooth) outcomes—modules are either present or absent; they are either switched on or off, and they operate either together with or separate from other modules. Everything in a healthy cell has a purpose. Used parts are quickly disassembled and the components are rapidly recycled, so there is never a large number of small items lying around that have no significant effect on the organism’s fitness. That means there is never a maximum frequency of modules at or near zero on the fitness-effects scale, as Fisher’s theory anticipated.
All species are able to tolerate and adapt to a certain amount of variation in their conditions of life. An intelligent creator would likely make VIGEs that are capable of giving a large boost to fitness—rather than just a small one—in order to move a species from one ‘adaptive range’ to another. Terborg listed endogenous retroviruses, insertion sequences, LINEs, SINEs, micro-satellites, and transposons among his candidate VIGEs. These are all multi-nucleotide sequences ranging in size from a few to few thousand nucleotides in length. A fitness advantage produced by rearrangement of VIGEs in a regulatory process is therefore more likely to yield a large beneficial change rather than a small one. The beneficial fitness-effects distribution should therefore have a maximum value well above zero, as observed.
In contrast, when it comes to deleterious amino-acid-changing mutations, these would be the kinds of events that break the protein based structural or functional modules, rather than simply rearranging regulatory circuits. Such breakage is more likely to produce large deleterious defects, not small ones, again as observed in figure 3. The beneficial response in the bacterial experiments was an over-production of cellulose, which allowed a colony to form and float on the surface of the liquid medium. The bacteria were engineered so that mutations which triggered the over-production also activated an antibiotic resistance gene. The bacteria were grown on a medium containing the antibiotic so only the mutants survived, while the non-resistant ancestral type was killed off. In this way the benefits of the mutations could be exposed before any selection for colony formation had occurred (the selection that did occur was produced by the antibiotic).
There were 39 different metabolic pathways in which a mutation could theoretically have yielded the observed result, but in fact it was observed in only three pathways, and each time it was in a regulatory component.53 To check for other kinds of mutations the authors re-engineered an ancestral form of the bacterium that lacked any of the observed mutations and found (over a somewhat longer period) that exactly the same mutations occurred over again. They concluded that the ‘evolution’ they were observing was not random but constrained by the pre-existing genetic architecture. These results exactly match what Kirschner and Gerhart proposed: first, that gene regulation is the ‘weak linkage’ that allows easy rearrangement of functional modules (cellulose production, colony formation), and second, that the pre-existing genetic architecture facilitates this useful kind of variation!
Note that these mutations did not contribute anything new to the species. They only tweaked the existing cellulose production machinery to achieve a beneficial outcome. The restriction of the ‘evolution’ to mutations in just 3 of 39 possible pathways also matches Davidson’s discovery that the hierarchical GRNs readily tolerate change only in their lowest-level control circuits. In the present case, enough extra cellulose to allow the colony to float became the optimum, and therefore the most common result, producing the peak of the distribution. Some mutations might have caused an oversupply of cellulose that could have depleted resources for other functions and these would form the upper tail of the distribution. Other mutations could have undersupplied cellulose, causing fewer bacteria to replicate and/or join the colony, thereby contributing to the lower tail of the distribution. Mutations that caused only a tiny oversupply of cellulose would be of little help in colony formation, so they probably survived at virtually zero frequency, as observed.
In contrast to the Normal distribution, the Gamma distribution curve in Figure 3 is telling us something quite different. First, the far left of the curve goes to zero frequency to show that mutation damage beyond this point is fatal. There is no comparable upper limit on the beneficial side (far right of the Normal curve) because positive benefits could theoretically extend well beyond the point shown. The Gamma curve maximum just to the right of the lethal zone is telling us that the majority of amino-acid-changing mutations cause sub-lethal but still near-fatal damage—they interfere in a major way with reproductive fitness. These are the kinds of mutations that natural selection cannot remove, and they accumulate, as Sanford’s model describes.
Discussion and conclusions
For a hundred years Darwinists had put their hopes in beneficial mutations to be the source of novelty that natural selection could accumulate to produce all the variety of life on Earth. But when they finally turned up, they just as quickly vanished again. There is no such thing as a beneficial mutation that can produce something new that did not exist before. There is no harvest of novelty for natural selection to reap and so fulfil the Darwinian dream.
Fisher’s theory—invented to save Darwinism from abandonment—is utterly contradicted by this new data. Beneficial mutations do not follow an exponential distribution with maximum value near zero as he expected. They describe a two-tailed Normal distribution with a maximum value well above zero. In similar manner, deleterious amino-acid-changing mutations in humans do not fit his theory either—they have a maximum value well below zero.
Both of these results can be explained by modularity: modularity in the structure of life (Kirschner and Gerhart’s Lego blocks), modularity in gene regulatory networks (Davidson’s hierarchy of Boolean logic circuits), and modular built-in variation-inducing mechanisms (Terborg’s VIGEs). These new theories of molecular systems biology are all grounded, either explicitly (Kirschner-Gerhart, Terborg) or implicitly (Davidson), on the same unavoidable assumption—that the functional variety of life comes from modular rearrangements of what was originally built in. It does not come from what mutations and natural selection have accumulated over time. Every example of apparently beneficial mutation in the literature can be explained by small changes in pre-existing biological structures and functions that have either been designed to respond in such ways or where damage to such mechanisms produces beneficial consequences. Nothing new is created that did not exist previously. The only thing that life has accumulated over time is an ever-growing burden of sub-lethal deleterious mutations driving us to imminent extinction!
Fisher’s theory grew over time to become the almost universally believed ‘scientific truth’ that all the variety of life on earth ‘evolved via mutation and natural selection’. But Sanford’s genetic entropy principle has exposed the impotence of natural selection, and here I have exposed the error underlying Fisher’s beneficial mutation concept. The detailed scientific truth about the history of life is yet to be unravelled, but we are making some giant strides in that direction. The roadmap has been outlined, and it points away from the grand scheme of the Darwinian dream and squarely towards Genesis chapters 1 to 11.
Acknowledgements
Dr Don Batten and three anonymous referees assisted greatly with comments on earlier drafts of this article.
References and notes
- Williams, A.R., Beneficial mutations: real or imaginary?–part 1, J. Creation 28(1):122–127, April 2014; creation.com/mutations-part1. Return to text
- Haldane, J.B.S., A Mathematical Theory of Natural and Artificial Selection, Part V: Selection and Mutation, Math Proc Cambridge 23(7):838–844, 1927 | doi: http://dx.doi.org/10.1017/S0305004100015644. Return to text
- Fisher, R.A., The Genetical Theory of Natural Selection, Oxford University Press, London, p. 53, 1930. Return to text
- McDonald, M.J., Cooper, T.F., Beaumont, H.J.E. and Rainey, P.B., The distribution of fitness effects of new beneficial mutations in Pseudomonas fluorescens, Biol. Lett. 7(1):98–100, 2011 | doi: 10.1098/rsbl.2010.0547. Return to text
- ReMine, W.J., The Biotic Message: Evolution versus Message Theory, St. Paul Science, MN, chs. 7–9, 1993. Return to text
- Sanford, J.C., Genetic Entropy and the Mystery of the Genome, 3rd edn, FMS Publications, New York, 2008. Return to text
- Williams, A., Human genome decay and the origin of life, J. Creation 28(1):91–97, April 2014; creation.com/human-genome-decay. Return to text
- Noble, D., Physiology is rocking the foundations of evolutionary biology, Exp Physiol. 98(8):1235–43 | doi: 10.1113/expphysiol.2012.071134. Return to text
- Spetner, L., Not by chance! Shattering the modern theory of evolution, The Judaica Press, Brooklyn, 1997. Return to text
- Truman, R., The Problem Of Information For The Theory Of Evolution: Has Tom Schneider Really Solved It? trueorigin.org, accessed 21 January 2014. Return to text
- Williams, A., Mutations: Evolution’s engine becomes evolution’s end, J. Creation 22(2):60–66, August 2008; creation.com/evolutions-end. Return to text
- Carter, R.W., Can mutations create new information?, J. Creation 25(2):92–98, August 2011; creation.com/new-info. Return to text
- Carroll, S.B., Endless Forms Most Beautiful: The new science of Evo Devo, Norton, New York, chs 8–9, 2005. Return to text
- rationalwiki.org, accessed 6 March 2014; Examples of Beneficial Mutations and Natural Selection, gate.net, accessed 6 March 2014. Return to text
- creation.com/search?q=beneficial+mutations. Return to text
- I have chosen to continue Fisher’s emphasis on “become” to keep readers aware of his invention. Return to text
- Wojcicki, A. et al., Gamete donor selection based on genetic calculations, United States Patent No. US 8,543,339 B2, 24 September 2013. Return to text
- Kassen, R. and Bataillon, T., Distribution of fitness effects among beneficial mutations before selection in experimental populations of bacteria, Nature Genetics 38:484–488, 2006 | doi:10.1038/ng1751. Return to text
- MacLean, R.C. and Buckling, A., The distribution of fitness effects of beneficial mutations in Pseudomonas aeruginosa, PLoS Genet. 5(3):e1000406, 2009 | doi:10.1371/journal.pgen.1000406. Return to text
- Kimura, M., The neutral theory of molecular evolution, Cambridge University Press, 1983. Return to text
- The GWAS policy of the National Institutes of Health illustrates this point, gds.nih.gov, accessed 26 February 2014. Return to text
- Yockey, H.P., Information Theory, Evolution, and the Origin of Life, Cambridge University Press, ch. 6, 2005. Return to text
- Boyko, A.R. et al., Assessing the evolutionary impact of amino acid mutations in the human genome, PLoS Genetics 4(5):e1000083, 2008 | doi: 10.1371/journal.pgen.1000083. Figure 3 is based on the four categories of fitness effects reported in their table 5: s < 0.00001, 0.00001 < s < 0.0001, 0.0001 < s < 0.001, 0.01 < s, where s is the selection coefficient and s = 1 means lethal, s = 0 means neutral. Return to text
- Several authors have suggested that there may be no truly neutral mutations. One possible explanation for apparently neutral mutations is genetic redundancy. See Terborg, P., Evidence for the design of life: part 1—genetic redundancy, J. Creation 22(3):79–84, December 2008; creation.com/baranomes-design. Return to text
- Fisher’s data were presented in his table 1, p. 51, and his assumption of equal frequency on pp. 18–19 and 38–39. The Fisher curves in figure 3 have maximum values higher than the others because the area under all curves reflects the proportions of mutations being compared and needs to be approximately comparable. Return to text
- A number of modifications to the exponential shape have been made by more recent authors but they still all qualify as ‘exponential-like’ with a maximum near zero. Return to text
- A few very rare diseases are caused by a single-nucleotide change. Return to text
- Molecular systems biology, msb.embopress.org, accessed 10 September 2013. Return to text
- evodevojournal.com, accessed 26 February 2014. Return to text
- Williams, A., Facilitated variation: a new paradigm emerges in biology, J. Creation 22(1):85–92, April 2008. Return to text
- Lightner, J.K., Designed to inhabit the earth: A review of The Plausibility of Life: Resolving Darwin’s Dilemma by Marc W. Kirschner and John C. Gerhart, Yale University Press, New Haven, CT, 2005, J. Creation 22(1):33–36, April 2008. Return to text
- Avise, J.C. and Ayala, F.J., In the light of evolution I: Adaptation and complex design, PNAS 104(Supp. 1):8563–8566, 2007 | doi: 10.1073/pnas.0702066104. Return to text
- Wilkins, A.S., Between ‘design’ and ‘bricolage’: Genetic networks, levels of selection, and adaptive evolution, PNAS 104(Supp. 1):8590–8596, 2007 | doi: 10.1073/pnas.0701044104. Return to text
- Gerhart, J., and Kirschner, M., The theory of facilitated variation, PNAS 104 (Supp. 1):8582–8589, 2007 | doi: 10.1073/pnas.0701035104. Return to text
- Parter, M., Kashtan, N. and Alon, U., Facilitated Variation: how evolution learns from past environments to generalize to new environments, PLoS Computational Biology 4(11):e1000206, 2008 | doi:10.1371/journal.pcbi.1000206. Return to text
- Kirschner, M.W. and Gerhart, J.C., The Plausibility of Life: Resolving Darwin’s Dilemma, Yale University Press, p. 227, 2005. Return to text
- I suspect this is the reason why the theory—even though it is based on solid evidence, is proposed by such eminent scientists, and has been well received at the highest level in the scientific establishment—has been so widely ignored since then. Return to text
- Kirschner and Gerhart, ref. 34, pp. 230–236. Return to text
- Grant, P.R. and Grant, B.R., How and Why Species Multiply: The Radiation of Darwin’s Finches, Princeton University Press, 2008. Return to text
- Terborg, P., Evidence for the design of life: part 2—Baranomes, J. Creation 22(3):68–76, December 2008. Terborg, P., Evidence for the design of life: part 3—an introduction to variation inducing genetic elements, J. Creation 23(1):99–106, April 2009. Return to text
- Sanyal, A. et al., The long-range interaction landscape of gene promoters, Nature 489(7414):109–115, 2012 | doi:10.1038/nature11279. Return to text
- Venters, B.J. and Pugh, B.F., Genomic organization of human transcription initiation complexes, Nature 502(7469):53–58, 2013 | doi:10.1038/nature12535. Return to text
- Djebali, S. et al., Landscape of transcription in human cells, Nature 489(7414):101–108, 2012 | doi:10.1038/nature11233. Return to text
- Davidson, E.H., Emerging properties of animal gene regulatory networks, Nature 468(7326):911–20, 2010 | doi:10.1038/nature09645. Return to text
- Istrail, S., De-Leon, S. B. and Davidson, E.H., The regulatory genome and the computer, Developmental Biology 310(2):187–195, 2007. Return to text
- Neph, S. et al., An expansive human regulatory lexicon encoded in transcription factor footprints, Nature 489(7414):83–90, 2012 | doi: 10.1038/nature11212. Return to text
- Britten, R.J. and Davidson, E.H., Gene regulation for higher cells: a theory, Science 165(3891):349–357, 1969. Return to text
- The Davidson Laboratory, Research Summary Overview, its.caltech.edu, accessed 20 November 2013. Return to text
- Davidson, E.H., The Regulatory Genome: Gene Regulatory Networks in Development and Evolution, Academic Press, San Diego, CA, 2006. Return to text
- Erwin, D.H. and Davidson, E.H., The evolution of hierarchical gene regulatory networks, Nature Reviews Genetics 10(2):141–148, 2009 | doi:10.1038/nrg2499. Return to text
- Davidson, E.H. and Erwin, D.H., An integrated view of precambrian eumetazoan evolution, Cold Spring Harbour Symposium on Quantitative Biology 74:65–80, 2009 | doi: 10.1101/sqb.2009.74.042. Return to text
- Truman, R., Information theory—part 3: introduction to Coded Information Systems, J. Creation 26(3):115–119, December 2012. Return to text
- McDonald, M.J. et al., Adaptive divergence in experimental populations of Pseudomonas fluorescens. IV. Genetic constraints guide evolutionary trajectories in a parallel adaptive radiation, Genetics 183(3):1041–1053, 2009 | doi: 10.1534/genetics.109.107110. Return to text


Readers’ comments
Comments are automatically closed 14 days after publication.