

Journal of Creation 35(1):89–97, April 2021
Browse our latest digital issue Subscribe
The Jurassic Coast, England and its dry valleys: periglaciation or Noah’s Flood?

The Jurassic Coast, an English World Heritage Site, attracts many geologists trying to understand its distinctive geomorphological features—particularly the numerous dry valleys. While uniformitarian geomorphologists persistently offer periglaciation as their best explanation, they admit that it and all other models are deficient. This paper evaluates a model associated with rapid subterranean uplift, and erosion through fast movement of the associated water. It has the hallmarks of the retreat of the Noachian Flood.
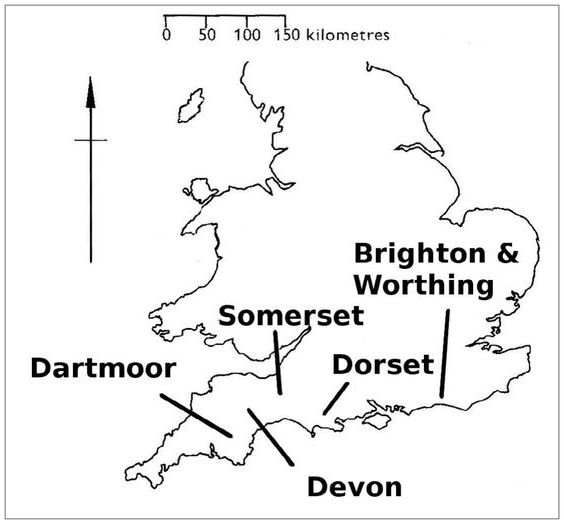


The Jurassic Coast, a World Heritage Site,1 extends for 155 km across the south-western counties of Devon and Dorset in England (figures 1 and 2). Its varied geology, which (in uniformitarian terms) includes sedimentary rocks from the Triassic to Eocene, attracts a wide range of geologists and oil prospectors. Uniformitarians ascribe the arrangement of the rocks to over 200 million years of slow sedimentation, modest erosion, and gentle uplift.
The landscape is amazing, with numerous dry valleys throughout these counties. Some lie on the coast while others, lying inland, merge into wider river valleys. Under Buckland’s2 influence geologists initially thought that many wide valleys, particularly in Devon around Seaton and Sidmouth (figure 2), were eroded out by the rapid retreat of the Noachian Floodwaters (table 1 provides the geographical locations of all features mentioned herein). In contrast, Lyell wanted to “free the science [of geology] from Moses”3 and insisted that his uniformitarianism fully explains everything.4,5 However, he offered no evidence or direct comparison to show that uniformitarianism was a better explanation than a robust biblical scheme. Moreover, he did not discuss dry valleys.
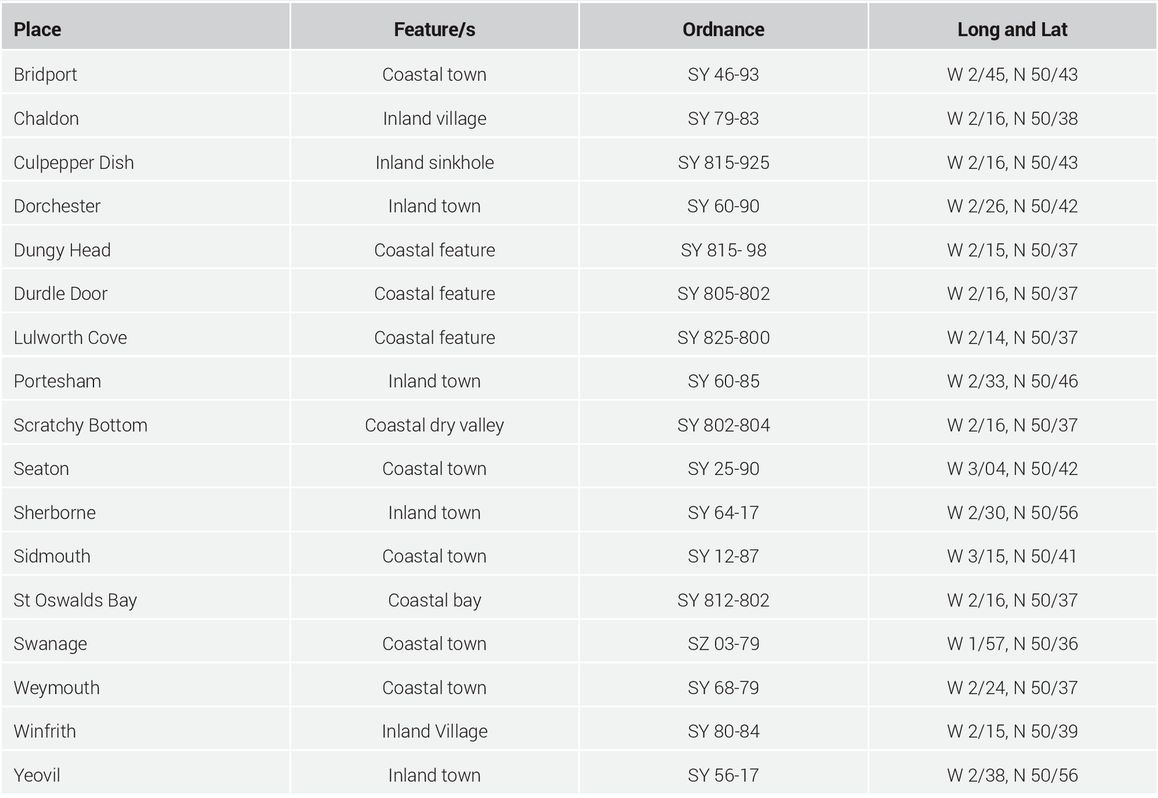
Table 1. Locations of places mentioned
Later, the belief that multiple ice ages had occurred led uniformitarians to suggest that, where glaciation had taken place, subsequent melting of ice sheets or the unlocking of stored water temporarily impounded by ice dams provided intense but short-lived torrents of water which apparently did the work of erosion, leaving behind dry valleys. It has been suggested that even Buckland was later prepared to accept that glacial effects were important agents affecting the landscape.4,6


Reid suggested7 that in areas adjacent to those glaciated, there would probably have been sub-zero temperatures. In consequence, freeze/thaw cycles could have resulted in breaking up of surface rock, which could then have been swept away by meltwater when each cold period relaxed. Repeated occurrences would then leave dry valleys when the most recent Ice Age Stage finally ended.7 As will be shown below, applying this model to the Jurassic Coast has not really worked. Nevertheless, it is the front-runner of around 20 ideas put forward to explain the dry valleys, judging by the way periglaciation is firmly identified as a feature of the area.8-11
First, this paper examines uniformitarian attempts to explain features of the landscape, such as dry valleys being created by periglaciation, and confirms the weaknesses that have already been identified with this explanation. Second, it proposes an explanation for dry valleys on the Jurassic Coast involving rapid uplift and fast movement of water, consistent with the retreat of the Noachian Flood. To achieve this, periglaciation and associated models must first be detailed. This will include reference to the inland dry valleys, which reveals the credulity geomorphologists have for periglacial explanations.
Glaciation and periglaciation in England
The last glacial maximum in England is judged by uniformitarians to have been in the period 116–11.7 ka, and named the ‘Devensian’ Stage.12 It only covered about 40–50% of northern England, so the ice sheets were always at least 200 km to the north of the Jurassic Coast. Prior to the Devensian, there was a ‘Wolstonian Complex/Stage’ (200–300 ka). Even earlier was an ‘Anglian’ Stage with ice sheets reaching further south than the Devensian and coming within 100 km of the Jurassic Coast. This distance is still too far to have had a direct hydrodynamic-erosional effect on the Jurassic Coast. Water spilt from the melting would have left hallmarks nearer the edges of the ice sheets long before reaching the Coast. However, much is uncertain about the precise boundaries of maximum movement of the ice sheets southwards and their order of encroachments. In particular, the “Anglian is not well-marked by end moraines but by … thinly scattered erratics”.10 Furthermore, the whole concept of a Wolstonian Complex/Stage is controversial because in the Midlands the Wolstonian sediments are beneath Anglian.
Table 2. Locations of dry valleys reviewed in this study

Uniformitarians are clearly uncertain over the timing, extent, and causes of the ice ages in England. Nonetheless, they generally consider that the region immediately southwest of the extremity of the Anglian ice age was an area of patchy periglaciation10 (figure 3). For example, periglaciation is considered to be the cause of the inland dry valleys, marked X on figure 3, but there is some equivocation over whether they were formed by a two-stage process.9 Furthermore, there is a dearth of the normal supporting periglacial features such as involutions and soil patterns in the south-west marked on published maps.10,12 The south-east of England, which appears to have evidence of permafrost, can be temporarily ignored, and treated in a later study.
The dry valleys
In Dorset alone the number of dry valleys runs into the hundreds. Some are short (500 m apex to mouth), others long (5 km); some meander while others are straight; some are on sandstone while others are on chalk; some end in coastal cliffs; and others merge into larger valleys containing rivers.
Figure 4 shows the classic, Jurassic Coast example of Scratchy Bottom. To date, a wide range of these dry valleys have been extensively reviewed.8-15 A map of the valleys in the coastal area of Lulworth and Durdle Door is shown in figure 5, with basic details in table 2. The dominant directions seem to be north to south, with a few east-to-west or westto- east. Four of those valleys end in the cliffs exposing the underlying rock layers. The details in table 2 were obtained from the contours on the ordnance maps supported by the author personally visiting a selection of locations and using GPS equipment to spot-check locations and heights shown on the maps.
Since the dry valleys on the coast all expose their underlying geology, strata, and folding, an integrated picture of events leading to their formation can be proposed. In contrast, only limited trenching has been possible on one inland valley to understand the subsurface geology and regional dips.9
Uniformitarian assessment of dry valley mechanisms
Twenty suggestions have been put forward for explaining dry valleys in England and Wales.8,10 It is reasoned that some dry valleys were produced during periglaciated conditions, and clear references have been made to Dorset’s inland dry valleys9 even though supporting evidence of periglaciation (soil patterns, involutions, etc.) in this part of the south-west is missing.10,12
Interestingly, it is also noted that given “the great diversity of dry valley forms and locations, no single explanation will suffice for all types.”10 When it comes to explaining a significant cluster of dry valleys in the Dorset portion of the Jurassic Coast, the latest recommendation is that researchers studying in this region review their suggestions and provide robust explanations.8
To justify periglacial explanations for at least some valleys, five arguments have been offered by Goudie.10 They are listed in order with individual comments directly embedded.
“Many of the dry valleys are fronted by a fan of debris (‘head’, coombe rock), which is thought to be frost-shattered debris moved by solifluction.”
‘Solifluction’ refers to the idea that fragments of rock, large and small, can move down slopes of just a few degrees by gravity alone. However, when trying to show that the coombe rock is frost-shattered debris by thermally cycling chalk below the freezing point in a laboratory, a slurry rather than chalk fragments was produced.16 Moreover, this fails to explain the variability in the debris and its structure (see below for specific examples).
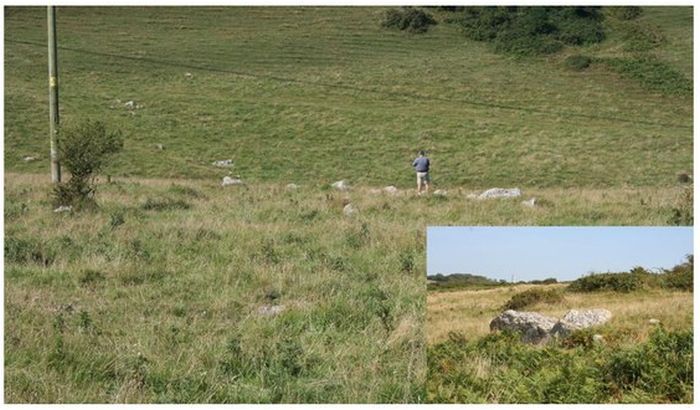
“Some dry valleys … contain sarsen blockstreams, the mechanism for the movement of which is probably solifluction.”
An example of sarsens (clusters of sandstone blocks) is from the Valley of Stones, near Portesham, Dorset. Figure 6 shows a distant view of some of the stones and a close-up of a cluster. It is not clear why this feature suggests a periglacial mechanism, which may explain why the word ‘probably’ was used in the statement.
“Some dry valleys have asymmetric slope profiles and cryopediments.”
It is argued that the asymmetric profiles are partly explained by the different angles at which the sun’s rays impinged on the area. This resulted in different levels of melting and water run-off, producing asymmetric erosion. But there are many valleys that are not asymmetric, oriented in every conceivable direction within small and large areas. The suggestion that this indicates periglaciation is thus flawed. On the cryopediments, the problem of explaining the origin of the broken rock by freeze-thaw cycles16 rules out Goudie’s suggestion, and so the sediments may not be ‘cryogenic’.
“The rarity of notches in the chalk scarp crests of southern England may be explained by the fact that most dry valleys are of periglacial origin and thus of no great age. Thus retreating escarpments have not had time to behead more than a small number of dip-slope valleys.”
The rarity of notches is not prima facie evidence for periglaciation. Moreover, ‘beheading’ is a mechanism used by uniformitarians to explain ‘so-called’ river capture, but it has a more realistic explanation through a Flood mechanism, e.g. in the English Weald.17
Finally, it is noted:
“Many of the dry valleys in the Chilterns do not seem to be related very strongly in their direction to the joints in the chalk, maybe because they were fashioned by periglacial torrents working on rock that was impregnated with permafrost.”
Based on Reid’s model,7 there is no uniformitarian answer as to where his convenient “torrents”, which are needed to move the sediment, came from. And while some dry valleys are almost straight (e.g. the Seven Sisters, near Brighton), there are many valleys which show meanders and even turn at right angles. To that extent, this can only explain a trivial number of valleys, and so adds little to the discussion.
Towards a robust explanation of the coastal dry valleys
As mentioned above, the dry valleys on the Jurassic Coast provide visible information on the underlying geology (i.e. the strata and their disposition). There have also been suites of seismic surveys and the drilling of deep oil wells in the area because of hydrocarbon extraction.18 While only some information collected has been made public, we can propose the following simplified geological history of the area without adhering to the uniformitarian timescale.


The earlier sediment deposits in the area along the coast from Swanage to Weymouth (about 40 km) were likely originally oriented almost horizontally (figure 7). Extensive folding then took place near what would become the coast (a monocline),19 resulting in some of the layers being tilted by up to 110° (although only drawn at about 70° in figure 8). Furthermore, some hinge-folding occurred, so that the almost-vertical layers do not follow a single compass direction. Now the Jurassic limestone (labelled JL) is quite hard, but in tilting its brittle nature likely resulted in much cracking and splitting, allowing the broken rock to be subsequently carried away by rapid run-off of water. The Wealden and Lulworth beds (WL) are soft. The chalk (C) is moderately hard, but in the tilting several faults developed, and one relevant to this study is shown hatched with the direction of movement indicated (figure 8).14
Could a Flood-type explanation be advanced for these dry valleys? In tandem, the boundaries of the regions that uniformitarians consider having been periglaciated will have to be pushed back. Indeed, the 11 examples used in this study (and many others in the area) suggest that a global flood with rapid retreat of the water is an exclusive and holistic solution. Periglaciation, as a competitor, is irrelevant provided that the following points are satisfied by this alternative model of events:
- There is a non-periglacial explanation for shattering the chalk before the valleys formed.
- The catchment areas for rain and snow are so small that they do not provide storage space for the necessary large volumes of water to achieve rapid erosion.
- The underlying rocks are quite permeable.
- That current erosional rates at the mouths of these dry valleys suggest a shorter timescale since their formation occurred (i.e. thousands of years ago not millions—conflicting with uniformitarian timescales and consistent with the biblical timescale).
- That multiple landform features indicate a short period of rapid erosion (i.e. the ‘retreat’ taking days not thousands of years, fitting within the one-year biblical timescale of the Flood).20
Reasons for an exclusive Flood explanation
These five issues can be addressed in the affirmative as follows:
Shattering the chalk before the valleys formed
At beach level, the chalk is exposed on these coastal dry valleys. It shows a mixture of light to heavy fracturing because of intense tilting and folding (figure 9). The dry valleys on the beach side (C1 to C5) cut through the upturned chalk roughly at right angles. Therefore, they were formed after the chalk had tilted, and thus after the chalk had fractured. Three of the valleys are cut into the Wealden sandstones, which are relatively unconsolidated. So, rocks in the area did not need to be pre-shattered by periglacial frost. The tilting was responsible for some, and unconsolidated sediments for the others.

At some locations along this stretch of coast, the chalk is not fractured. It is heavily consolidated and seemingly impermeable, judging by the slower coastal retreat (figure 10). Dry valleys are not present there. Furthermore, these consolidated regions would have exerted control on the formation of dry valleys, limiting their east-west development. See the Scratchy Bottom example below.


Minimal catchment areas
Figure 5 shows that there are no catchment areas for rain and snow of any significant size, or even space for ice dams. So, calculations of the amount of ice to be thawed are redundant. There are sets of opposing dry valleys (such as C4 and XC8, C3 and XC7, C2 and XC6), and the area between these opposing valleys is on an anticline. The uplift of the anticline from 200 m below the water level caused water to run both north and south in the ‘torrents’ desired by Reid7 and eroding out the dry valleys. The 200 m depth of water suggested by uniformitarians at the end of the ‘Cretaceous’ period21 and available to erode the valleys is consistent with a Flood explanation.22 The Flood likely began to retreat in the ‘Upper Cretaceous’, though it is not a universal time-marker because of inconsistencies in the geological column.23
The valleys were permeable
Since many of the fractures show staining from the ‘Eocene’ sands and gravels, which originally lay above the chalk (figure 9), there was a ‘fracture’ permeability. Bulk (or matrix) permeability is even clearer because of a feature known as ‘Red Pipes’. The pipes were first described when a huge feature called ‘The Red Hole’ in St Oswalds Bay was noted.13 It originally showed in the face of the cliff and extended below beach level, but evidence of it has been lost because the cliff has retreated. Further ‘pipes’ have since been exposed and removed.22
Figure 11 illustrates this mechanism. A number of ‘pipes’ containing ‘Eocene’ sands and gravels vertically penetrated the upturned chalk, shown in plan and cross section. The pipes were effectively drainage features. The chalk, while still unconsolidated in places, was still saturated by water during uplift. While the chalk was uplifted above sea-level, and as water left the areas in sheet-form overland, and concentrated channel-flow over the top of the rocks, additional water drained downwards by ‘Darcy’ flow, carrying with it loose chalk.
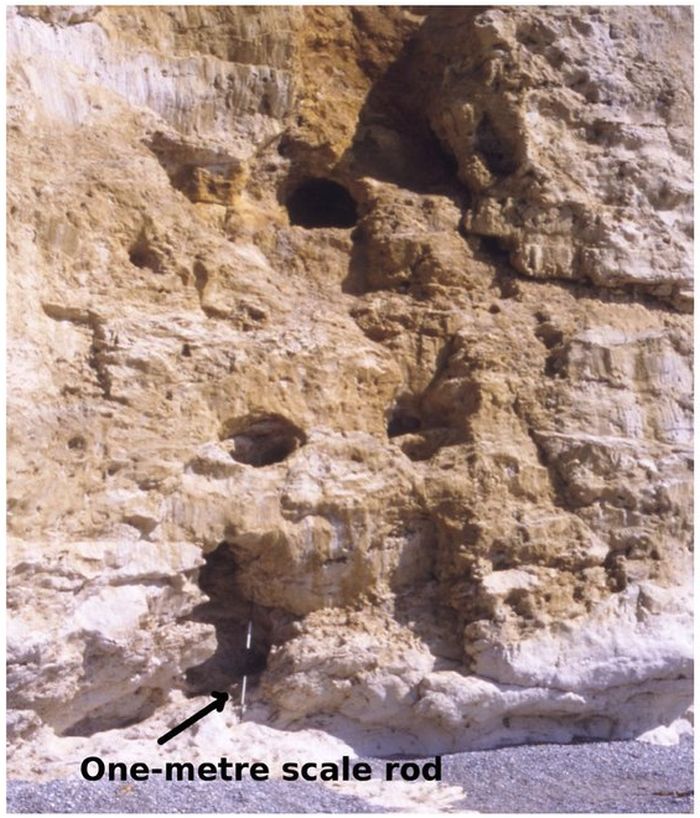

Pipe A represents ‘The Red Funnel’ (~1947) and pipe B the feature in the author’s photograph (~2005) marked (*) (figure 12). Evidence of these has since been lost to cliff retreat—the one marked (*) in the winter 2008/9. Pipes C1 and C2 represent pipes that are half exposed at the present. Pipe D is hypothetical at this stage since it has yet to be exposed. Note that there is no surface expression of the ‘pipes’ because of grass land coverage.
Uniformitarians argue that these ‘pipes’ were formed by chemical dissolution since rainwater is slightly acidic.14 The creationist counterchallenge is:
- It needs more than a few years to chemically remove large quantities of chalk with a very dilute acid. We don’t have major amounts of time based on re-assessing radiometric dating24 or the assessment of time described below in item 4.
- Erratic pathways are more likely to form than reasonably straight, vertical ‘pipes’ (as experience of chemically fracturing oil wells in chalk demonstrates) if rainwater is focused in a small area. In addition, if the uniformitarians insist that the folding was slow, then the pipes would not be vertical, but would have curved sections corresponding to the rate at which the tilt progressed.
- There are many sinkholes in the area, including the famous Culpepper Dish,14 which are found at higher elevations. So, acidic dissolution of chalk is not a phenomenon in the area. Rather the evidence points to a collapse of soft material.
- Some of the ‘pipes’ show rapid entry of the ‘Eocene’ material as if it had gone down a pre-existing lift shaft. On its journey down, some segregation of fragment sizes occurred (figure 13) consistent with falling through a viscous medium such as water.
- The flint, originally interspersed in the chalk and immune to attack from dilute acid, should collect at the bottom of a ‘pipe’. It is not there.
Recent erosional events
To resolve how recently the events happened, note that the chalk cliff is receding by several centimetres per year at various locations in the bay.25 The offshore stubs of ‘Jurassic’ limestone rock are around 200 m away and are submerged at high tide (figure 10, taken at low tide). At some stage in the past, the tilted limestone would have been higher (this is visible in the cliff in the same rock in the distance, Dungy Head, and observable in the cliffs a short distance to the west—from where the photograph was taken—at the Durdle Door Arch). It would therefore have protected the chalk cliff against erosion from the sea and tide. The removal of the top sections was almost certainly coincident with the development of dry valley S3 since it reaches down to beach level. So, the time to erode the chalk to its present position from the stubs of Jurassic limestone is around a few thousand years based on the present rate these cliffs are retreating—perfectly consistent with biblical timescales.
Possible rapid erosion
Evidence for fast formation of the valleys (in a matter of hours) is provided when we consider Lulworth Cove and Scratchy Bottom.
Lulworth Cove
The Cove has four dry valleys entering it (figure 5). The valley S1 runs from the east, and it is in a trough roughly parallel with the almost upright Wealden and other soft rocks, which are sandwiched between the chalk and the Jurassic limestone. This points to it being a direct product of the global Flood water running into what would eventually become the Cove over soft rocks. The ‘coombe rock’ at beach level is a rather jumbled arrangement of Wealden clays and sands. The catchment area, for rain or snow, is so limited that it rules out uniformitarian explanations based on storage followed by release of water from melted snow or breaching of ice dams. Also, the significant slope (~ 5°) rules this out as a normal near-coastal valley because it is more akin to those in mountainous regions.
One valley originates in the NE over chalk (C1). It then merges with another chalk dry valley (C2) from the west. Valley C1 is almost linear and, rather like valley S1, it followed this course because of east-west faulting (figure 8) in the chalk, opening a pathway of easily erodible chalk fragments. A further dry valley joins them from the west—namely S2. This is also over part of the chalk, strictly speaking, and not just the Wealden sands, etc. But this valley has an unusual floor. The valley slopes at about 15° to the east, the floor is almost planar but slopes NE by about 5°. This unusual disposition points to:
- a very rapid flow of water (The Moody river equation for this slope would suggest ~100 km/h), and
- a single pulse of surface water, otherwise smaller entrenched mini valleys would be present in the floor.
Coombe rock from these three merged valleys is observable in the cliffs at the Cove. Close access is not possible because of a steep crumbling cliff, but photographs show the important features (figure 14). At least three distinct pulses of coombe rock are observed, which may be attributed to deposition of erosional products from each of the three valleys, or at a maximum, three pulses from a single valley. The chalk fragments are slightly rounded, and that is consistent with tumbling motion as they moved down the valleys. There is a degree of segregation within each pulse, which contradicts ideas of slow and repetitive erosion from periglaciation.
Scratchy Bottom


Many of the dry valleys show a degree of taper from their apex, particularly Scratchy Bottom. The significant degree of taper supports the dry valleys having been formed by land lifting rapidly from beneath ~200 m of water. The amount of water flowing over the emerging land increases with distance from what eventually becomes each ‘apex’ to the respective mouths. In consequence, the depth and width of each valley increases significantly with distance from their apexes.
Scratchy Bottom also has an abrupt right-angle turn. The flow of water over the upper portion (east-west) has eroded the Wealden (much as valley S1). It then eroded southwards because fracturing in that orientation has also occurred. The water then removes the loosened chalk. Evidence for the fracture can be seen in figure 5 just beyond the figure marked by the line of *** but is more clearly confirmed at beach level (figure 15).
The final factor pointing to a single rapid pulse of water cascading south is the conical shape of the coombe rock. It is asymmetric and around 10 m higher in the west. The shape of the valley means that the water would have flowed faster on the outside of the bend to the extent of 14 m/s.26 With velocities of this order, all the water above Scratchy Bottom (200 m) could have flowed through its ‘mouth’ in under an hour.
To conclude this section, we have:
- confirmed Goudie and Brunsden’s view that periglaciation cannot explain the dry valleys on the Coast, and
- found that the evidence points to the valleys having been formed during the rapid retreat of the Noachian Flood.
Summary and further work
This study has confirmed what uniformitarians have long considered—namely that the dry valleys on the Jurassic Coast cannot be explained by periglaciation. Based on geological data going back 70 years and the author’s observations over the last 20 years, the evidence suggests that these valleys were formed during a period of rapid uplift and fast movement of water, all having happened no more than a few thousand years ago. A logical extension to this interpretation is that it is consistent with the description of the tail end of the Noachian Flood in the Bible.
The study has also shown tantalising evidence that the dry valleys inland of the coast may also have been formed by the same mechanism, rather than periglaciation as assumed by uniformitarians. That in turn suggests that many regions in southern England have been declared as periglaciated when, in fact, they were not. Thus, it opens a door to further work on this region of England to examine other features of the landscape that may (or may not) point to evidence for the Flood.
Acknowledgements
I acknowledge Dom Statham and Michael Oard’s encouragement and help in preparing this paper. The peer reviewers have also kept me on my toes. Any weak points herein are mine alone.
References and notes
- Smith, R., World Heritage Sites of Britain, AA Publishing, Basingstoke, 2010. Return to text.
- Buckland, W., On the excavation of valleys by Diluvian Action, as illustrated by a succession of valleys which intersect the South Coast of Dorset and Devon, Transactions of the Geological Society of London, Series 2, 1(1):95–102, 1822. Return to text.
- Lyell, K.M., The Life, letters and journals of Sir Charles Lyell, Bart, vol. 1, John Murray, London, pp. 240, 318, 1881. Return to text.
- Rudwick, M., The Great Devonian Controversy, University of Chicago Press, Chicago, IL, pp. 42, 117, 1985. Return to text.
- Lyell, C., Principles of Geology: Being an attempt to explain the former changes of the earth’s surface by references to causes now in operation, vols 1–3, John Murray, London, 1830–1832. Return to text.
- Imbrie, J. and Imbrie, K.P., Ice Ages—Solving the mystery, The Macmillan Press, London, p. 39, 1979. Return to text.
- Reid, C., On the origin of Dry Chalk Valleys and of Coombe Rock, Quarterly J. Society of London 43:364–373, 1887. Return to text.
- Goudie, A. and Brunsden, D., Classic Landforms of the East Dorset Coast, The Geographical Association, London, 1997. Return to text.
- French, M., The Periglacial Environment, Longman, London, 1976. Return to text.
- Goudie, A., The Landforms of England and Wales, Blackwell, Oxford, 1990. Return to text.
- Williams R.B.G., Frost weathered mantle on chalk; in: Boardman, J. (Ed.), Periglacial Processes and Landforms in Britain and Ireland, Cambridge University Press, Cambridge, p. 127, 1987. Return to text.
- Ballantyne, C.K., Periglacial Morphology, Wiley, Blackwell, Oxford, 2018. Return to text.
- Arkell, W.J., The Geology of the Country around Weymouth, Swanage, Corfe and Lulworth, London, HMSO, 1947, revised 1978. Return to text.
- House, M.R., The Geology of the Dorset Coast, Geologists’ Association, London, 1989. Return to text.
- Sparks, B.W., Geomorphology, Longman, London, p. 456, 1972. Return to text.
- Williams, R.B.G., Permafrost and temperature conditions in England during the last Glacial Period; in: Pewe, T. (Ed.), The Periglacial Environment, McGill-Queen University Press, Montreal, 1969. Return to text.
- Matthews, J.D. and Oard, M.J., Erosion of the Weald, Southeast England Part II: a Flood explanation to the mystery and its implications, CRSQ 52(1):22–33, 2015. Return to text.
- Underhill, J.R., Development, Evolution and Petroleum Geology of the Wessex Basin, Geological Society London, Special Publications 133, 1998. Return to text.
- The monocline almost certainly developed while sedimentation was proceeding because the thickness of many individual layers varies over short distances. Return to text.
- Oard, M.J., Flood by Design, Master Books, Green Forest, AR, 2008. Return to text.
- Rayner, D., The Stratigraphy of the British Isles, Cambridge University Press, Cambridge, 1981. Return to text.
- Matthews, J.D., Chalk and ‘Upper Cretaceous’ deposits are part of the Noachian Flood, ARJ 2:29–51, 2009. Return to text.
- Matthews, J.D., The stratigraphic geological column—a dead end, J. Creation 25(1):96–101, 2011. Return to text.
- DeYoung, D., Thousands … not Billions, Master Books, Green Forest, AR, 2005. Return to text.
- This is the author’s observation based on monitoring over 20 years. The rates are not steady. One winter, parts of the cliff may recede by 1–2 metres and then remain in a semi-stable configuration for several years. Goudie (p. 250) notes higher rates of retreat in parts of the chalk cliff to the west of sections discussed here. Return to text.
- The formula used to establish this is the standard one for converting potential energy to kinetic energy—half the velocity squared equals the gravity constant times the height difference. Return to text.


Readers’ comments
Comments are automatically closed 14 days after publication.