

Journal of Creation 36(2):34–39, August 2022
Browse our latest digital issue Subscribe
The promises and pitfalls of correlating Y chromosome genetics to human history
Review of: Traced: Human DNA’s big surprise by Nathaniel T. Jeanson
Master Books, Green Forest, AR, 2022
Dr Nathaniel Jeanson, a fellow creation geneticist, has recently published Traced: Human DNA’s Big Surprise,1 a book that claims to explain biblical human history using genetics. An endorsement on the book cover says he has “found the Rosetta Stone of human history”.
The book is sparking a lot of interest within the creationist community, and for good reason; it is the first book of its kind. He has done a significant amount of research and deserves commendation for an interesting hypothesis. Full disclosure: Dr Jeanson and I have discussed these issues in depth over many years. He even had me review one of the chapters prior to publication, for which I received a glowing acknowledgment. The observations made in this review are purely in the interests of robust peer review, which we believe to be a healthy exercise when promoting various hypotheses.
Grammatically and orthographically, the book is excellent. Structurally, the book reads well, in that it follows a logical path. There were a few sections, though, that were essentially unreadable due to numerous statistics crammed into single paragraphs. Most people would have great difficulty following such lines of thought.
A second issue has to do with the book’s layout. The centre third of the book is composed of 235 colour plates, to which the author refers frequently in the text. There are no other illustrations in the book, so the reader must constantly thumb back and forth between what is being read and the illustration that goes along with it. Many of these colour images could easily have been done in black and white and inserted into the text.
A third issue appears early on. The analysis begins without explaining to the reader what is going on. For example, how does a person compute the ‘age’ of a group of people or the timing of a historical event from a phylogenetic tree? This is not explained, but multiple hard dates start appearing near the beginning of the book. They are cited with no qualification and no explanation of where they came from. It would have been beneficial to have provided a brief explanation, with a pointer to detailed methods in the included appendix. There are hints in the text (i.e. in a few footnotes) that this material was once part of the main text. If so, its removal may have simplified the material, but the lack of explanation may prevent supporters from answering skeptical objections. Interested readers can follow the citation list to obtain this material, but the casual reader will miss out.
By way of explanation, he applies the general rule that three Y chromosome mutations occur each generation, except for the first generation after Noah, to which he applies seven mutations. The figure of ‘3’ comes from his analysis of Y chromosome sequencing studies.2 It is not trivial to derive mutation rates from sequencing data, because the error rates inherent in the data are on the same order of magnitude of the in vivo mutation rate. Thus, all papers published on the subject to date have applied significant filtering steps to the data before the final estimates are reported. This is frustrating, to say the least, since an accurate estimation of the mutation rate is one of the things that will separate the young-earth and the evolutionary models of human history.
Finding Noah

Dr Jeanson also picked a specific ‘root’ for the human Y-chromosome tree. He has documented this in several publications but does not discuss the other viable alternatives in Traced. Once that root (e.g. Noah) is chosen, it is possible to count the number of mutations from the root to the tips of the branches on the Y-chromosome tree. Since the length of each branch is proportional to the number of mutations each individual carries (some averaging occurs in the inner branches), by dividing this length by ~4,500 years (the time since the Flood), one can obtain a mutation rate for each major branch. He uses an average rate for each branch, though, because not all individuals are equidistant from their group ancestor.
Jeanson includes one large Y-chromosome tree (figure 1), but does not explain why the tree starts at his chosen point and not where the evolutionists want it to be. There is an appendix that explains some of these major assumptions, but the explanations were overly technical and thus not very helpful. Presenting a creationist model for human history is important, and Jeanson needs to be complimented for being first to do this. Yet, a comparison to the evolutionary model would seem to be very desirable in a book of this nature.
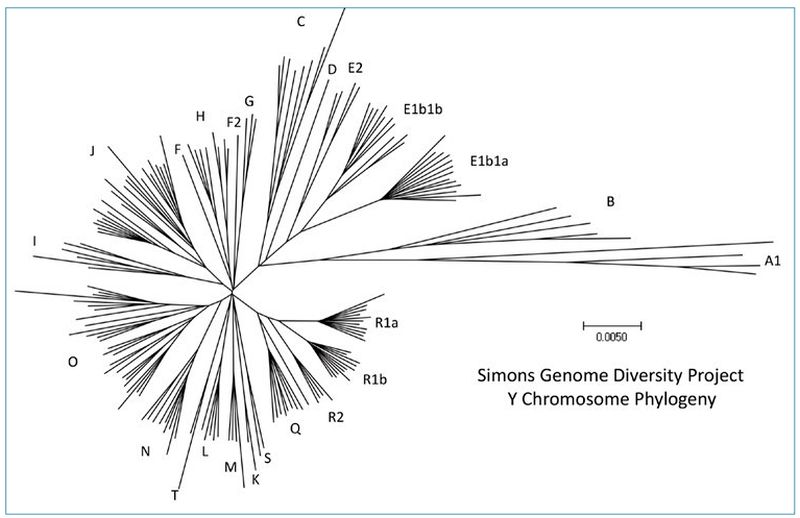
There are other ways to represent the same data. Figure 1 was derived from a diverse set of Y chromosomes reported by Bergström et al. (2020).3 Figure 2 is an unrooted tree that represents the Y chromosomes reported by the Simons Genome Diversity Project,4 which was reported in Carter, Lee, and Sanford (2018).5 Even though the data are displayed differently, the major branches are represented in both trees. This has implications for the question of potential ‘missing’ branches in modern data sets, as will be discussed below.
This approach has the advantage of not requiring a monotonic molecular clock across all lineages, all geography, and all time. However, and he admits this in the book, this necessitates that some lineages have a higher mutation rate today or at least had a higher mutation rate in the past. Since the most discordant lineages are in Africa, he appears to be saying that (some) Africans are more mutant than non-Africans.
A respected colleague who works in this field has strongly cautioned against saying anything like this in public. Yet, if something is true it needs to be said, so there remains an open question: are mutation rates variable among populations? Evolutionists partially avoid this problem by placing Y Chromosome Adam on an exclusively African branch. This reduces the extreme differences seen in Jeanson’s tree, but it does not completely avoid the problem, because some groups are still farther from the root than others, as has been documented elsewhere.4 Also, since non-Africans carry much more Neanderthal DNA than do Africans, and since Neanderthal DNA is highly divergent from that of modern humans, one can conclude that non-Africans carry many more mutations in their nuclear genome than do Africans. This partly blunts the non-politically correct aspects of the divergent African lineages.
Yet, the most important parts of the tree are the earliest, inner branches. There is a lot we do not know about this early period in human history. One cannot estimate the number of generations that separates any two closely spaced branches based on the number of mutations. A single-base difference could arise between men separated by zero (brothers), one (cousins), two (second cousins), or more generations. Assuming mutations are random, even if things average out over long periods of time, we cannot put our finger on a phylogenetic tree and know how many generations separate people who lived close in time.
Interestingly, his method iteratively calculates the mutation rate for each branch and sub-branch separately. This creates the scenario where it is possible for the mutation rate to change depending on which branch one is following, but it synchronizes the mutation rate where any two branches join. Thus, it is possible to calculate different times for the same event depending on which groups are included. Jeanson is aware of this quirk, but it does not seem to affect any of his conclusions.
The molecular clock concept (even if only applied to the local tree topography) is a simplifying assumption in Jeanson’s model. This does not make it wrong, per se, but it does qualify his conclusions. For example, there are several ways for mutation rates to have been enhanced in the past. Higher radiation loads due to people living on newly exposed rocks that contain uranium, a fluctuating magnetic field of the earth (which would produce pulses of increased cosmic ray activity at the surface), and changing radionuclide decay rates could all affect mutation accumulation rates. Recent work has shown that specific modern individuals can pass on up to 7-fold more mutations to their children than average. These people are rare (12 out of 21,879 individuals studied), but they are present. The excess mutation rates were associated with defective DNA repair systems (two families) or the exposure to chemotherapy agents prior to becoming a parent (five families). Also, nine of the 12 hypermutating individuals were male, and paternal age was a significant contributing factor.6 Even though the burst of excess mutations was not associated with disease in any of the children, this does tell us that extrinsic factors can affect inter-generational mutation accumulation rates.

However, patriarchal drive is a strong mutational force (figure 3)7 which is virtually ignored in Traced. The Bible says people lived a long time in the past and many had children at great ages (cf. Genesis 5 and 11). We know from science that older fathers pass on more mutations. Estimates vary, but it is probably greater than one extra mutation per additional year of paternity.8 The reason for this is that male reproductive cells continue to divide from puberty to death, and every time a cell divides, more mutations are added to the genome. The female reproductive cells undergo fewer cell divisions before they are ready and then remain in an undividing state until ovulation and fertilization many years later.9
Thus, males are the main contributor of most single-letter changes and the post-Flood Patriarchs would have been producing children with a lot more mutations than the modern average as they aged. These children would naturally have had a high status in the rapidly growing population, but they would also have become rare as the population ballooned. In essence, after a few centuries, there would only be a handful of long-lived people living in a sea of short-lived people who are many generations removed from Noah. What this means is that you can’t necessarily look at the length of a branch on the family tree and divide by ‘4,500 years’ to get a mutation rate. The branching pattern does not change when you invoke higher mutation rates in the past, but the timing of events does.
It is also not true that Shem, Ham, and Japheth should be expected to have had the same number of mutations on their Y chromosomes as Noah. In the testes, spermatogonia reproduce clonally, and the cell count for any particular clone waxes and wanes over time.10 Since Noah was over 500 years old when his sons were born (Genesis 5:32), we can reason that they would have been born with many mutations (possibly a major factor in the sharp drop of lifespan from Noah to Shem11). However, the exact number would depend on which spermatogonial lineage contributed to each of the sons. It is entirely possible for two of them to have been born with essentially identical Y chromosomes while the third could have had a radically different Y. Or they could all have had identical Y sequences. Or each could have had a unique sequence. We cannot know, so it is impossible to place Noah and his sons on any chosen internal node of the Y-chromosome family tree. All we can say is that we expect them to be near the centre of the starburst.
Ancient DNA is a creationists’ friend
Traced includes no significant discussion of the burgeoning new field of ancient DNA (aDNA) studies. There is a trend among many creationists to discount aDNA.12 Many claim the data are riddled with errors and, therefore, cannot be trusted. Jeanson is not necessarily of this mindset. He indicated (personal communication) that the model worked so well without it that he saw little reason to include a discussion of aDNA, yet he is also open to the possibility that aDNA could be included in future creationist work on human history.
In reality, aDNA has finally opened up the murky world of early post-Flood history to us. We should be studying it intently while trying to turn the evolutionary conclusions on their ear. Are there errors in the data? Yes, many. This means we cannot be certain about the mutation load of any specific individual, because many of the ‘mutations’ they carry could easily be due to post-inhumation chemical degradation of DNA. DNA sequencing is already an imperfect science. Adding non-canonical nucleotides to DNA is problematic. For example, the deamination of cytosine occurs easily and frequently both in the cell and in the ground. This creates uracil, which does not belong in DNA and must be accounted for before any DNA amplification steps are performed on aDNA. This does not mean, however, that much information cannot be drawn from aDNA.
Isolating aDNA is like finding an old book that has been buried for a long time. It might be riddled with worm holes, have pages missing, and be covered in mould spots. Yet, at any stage before complete destruction, it should be possible to discriminate between old copies of, say, the Bible, a collection of Shakespeare’s sonnets, and Tolstoy’s War and Peace. In fact, some of the greatest discoveries for Christianity involved pulling dilapidated old tomes from mouldy monastery shelves, which allowed us to track various manuscript families, in some cases, due to introduced copying errors (similar to the way we track genetic mutations). If we had ignored that material because it was ‘error prone’, we would have missed much.
With aDNA, we can see the progression of people in places like Europe: from Neanderthals to hunter gatherer societies to ancient farmers to modern Europeans. We can see where the ‘light skin’ genes entered Europe and where they came from (e.g. Anatolia).13 We can also see that the people most like modern Europeans in their genetics lived in the Central Asian steppes and did not enter Europe proper until rather late in history.14 Similar stories of ancient migrations and gene flow can be told for all major regions of the world. aDNA should not be rejected by the creationist community. Instead, we need to incorporate it into our ideas of history, to whatever extent possible. We will, of course, reject the secular timeline, but the relative order of events is easily seen.
For example, when looking at ancient Europeans, it is clear that they have different genetics compared to modern Europeans. In fact, post-Neanderthal Europeans almost universally carry alleles that are associated with dark skin and blue eyes.15 So many people have been discovered with those alleles that no level of statistical guesswork is required. Likewise, every time we sequence a new Neanderthal, it clearly falls among other Neanderthals, including the alleles that separate Neanderthals from other humans.16 In Denisova Cave, near the border of Russia, China, and Mongolia, a girl was found who was ½ Neanderthal and ½ Denisovan, but the Neanderthal half was not related to the Neanderthals who were buried only a few feet away. Instead, the Neanderthal part was related to Neanderthals found in Croatia, thousands of miles away.17
Also, given a 3-billion-letter genome, and given the fact that only a relatively few nucleotides are phylogenetically informative, the usefulness of aDNA is a matter of statistics. One can infer which branch an individual belongs to even with highly fragmentary DNA. Creationists who reject all aDNA studies are missing a wealth of information that tells us about population growth and movement in the darkest periods of human history. This is the true ‘Rosetta Stone’.
Is aDNA accurate? Yes, depending on what you are trying to glean from it.
Important information missing
Strangely, in a book about human history, there is no discussion of the genetics of ancient people like Neanderthals and Denisovans. Jeanson would agree that these people were human, and thus descendants of Noah, but where do they fit in? Worse, some living people are up to 7% Denisovan and 3% Neanderthal.18 Should we not talk about how they can be 10% ‘non-modern’ in a Flood/Babel context?
There is also little discussion of the archaeological evidence for the most ancient human occupation, how it reflects the initial post-Babel wanderings and how the ancient-most people may or may not be related to the modern people living in those areas today.19 Also missing is any discussion of mitochondrial genetics and how mtDNA can also be ‘traced’ back in time. He admits to not knowing much about history several times in the book, so the reader is left wondering if his conclusions are more tentative than they seem.
Major differences of opinion
While there are many interesting facts presented in Traced, areas of disagreement will necessarily appear. For example, when discussing which Y lineage represents Abraham, Traced discusses the Cohanim, a group of Jewish men who claim direct descent from Aaron. Yet the book discounts the one lineage with the highest representation among the modern Cohanim (J) and opts for another (T). When discussing the Lemba of southern Africa, he notes that this alternative Y chromosome is found among them, but he never mentions that the Cohen Modal Haplotype (a subset of J) is also found among them, and that it is found among the men who serve as priests!20
Granted, statistical probabilities are not historical realities. The original founding group for a modern population could be a minority group (or absent altogether). Yet, there are good reasons for not assuming that the majority Y chromosome among the Lemba represents the founding lineage of the Jews. Their own account says they were founded by a small number of Jewish mariners. This is not a robust sampling of a population, and commercial endeavours like this are often undertaken by closely related males. For example, Peter and Andrew were brothers (John 1:40), and the brothers James and John were their partners in the fishing business (Luke 5:10). If a group like this had become marooned on a foreign shore, there would be no reason to assume their descendants would represent the majority Y chromosome among the source (Jewish) population. Alternatively, they may have hired random, non-Jewish sailors for the voyage, meaning there might not have been any correlation between Lemba and Jewish Y chromosomes. It is possible that T is the haplogroup of Abraham, but J is more likely.
This has follow-on effects. Discounting group J as the Jewish ancestral group flips the major branches that can be attributed to Shem and Japheth. This restricts Japheth’s descendants to the Middle East and sends Shem’s descendants across Eurasia. There is nothing wrong with Shem being widely distributed, but the tenor of the Table of Nations regarding Japheth indicates that his people were spread far and wide (c.f. Genesis 10:5), specifically along the Mediterranean coastlands, which opens up exploration of Europe proper.
He indicated (personal communication) that the answer to the riddle of J vs T for Cohanim ancestry was derived from other data, inside and outside of the Bible, and corresponds with many independent metrics. This was not clearly explained in the book, and the conclusions seem to have been arrived at prematurely. This is an area for continued discussion and analysis.
Traced also spends much time talking about the founding lineages for people groups mentioned in Genesis 10. Many will disagree with his quest to assign Y chromosomes to specific people groups. For example, is it possible to identify the ‘Persian’ Y chromosome? Differences among Y chromosomes have no phenotypic effect, so one cannot tell which man is related to whom by outward appearances. People groups also mixed in history, and armies frequently used foreign mercenaries, so any army is likely to include a diversity of Y-chromosome lineages. Also, just because an army invaded some area does not mean that they exterminated every single male in that region. What ‘Persian’ Y chromosome would one expect to find? The lineage of the king might be known, but his Y chromosome might be quite rare compared to the diverse people over which he rules.
Molecular clocks create highly unlikely scenarios
Based on Jeanson’s molecular clock approach, he is forced to conclude there was a 100% replacement of all Native American Y chromosomes (group Q in figures 1 and 2), from northern Canada to Patagonia, just a few centuries ago.21 He cites one Native American oral history in the book to back up the claim and tries to give a mathematical exposition on how such a thing could occur.
Consider what it would take to replace all Native American Y lineages with a single lineage that arose recently. The population would have to contract to near extinction (amounting to something like a 99.999% reduction) and rebuild from a specific small subpopulation, leaving most of both continents uninhabited for centuries. There is no evidence for that. Alternatively, a single tribe would have had to to invade from Asia and exterminate every single male Native American across both continents. To put it simply, this is highly unlikely.
A general reduction of the population across the entire inhabited area also does not work, because the resulting family tree collapse would occur at random. The arrival of the smallpox virus after 1492 was not even able to produce a scenario where all Native American male lineages trace back to a single individual, and various estimates suggest the population decreased by over 90% due to disease in the post-Columbian era. The frequencies of the various lineages before and after the reduction should be preserved during periods of population collapse. Even at extreme levels of reduction, any given small subpopulation would contain a random sampling of the original Y-chromosome diversity. The probability that they would all end up with the same branch, at random, is vanishingly small. To say that, at random, all lineages but one peter out across both continents is making a statistically indefensible argument. If this is what the data are telling us, then so be it. But, the effects of patriarchal drive would create a situation where branches grow more quickly in the early post-Flood years than in later years. Thus, the date for the Y chromosome ancestor of Native Americans given in Traced could easily be inflated. Positing an earlier date for the formation of the Native American branch removes the requirement that all paternal lineages were replaced long after these people crossed over from Asia.
Are there more Y-chromosome lines to be discovered? Probably not, for the tree has been fleshed out. That is, statistically, the likelihood of finding additional major branches is going down rapidly. The last major discovery was of a unique Y chromosome that was discovered by Ancestry.com. An American man named Albert Perry, a descendant of African slaves, carried a Y chromosome that has now been assigned to group A00. Further work turned up similar Ys in Cameroon.22 We now have millions of Y-chromosome sequences in private and public databases and no other major branches have been revealed. Does this mean that no new discoveries will be made? Not necessarily, but we should not be expecting that the Y-chromosome family tree will look much different in the future.
Conclusions
Traced represents a significant milestone in creationist literature, in that it represents a major attempt to bridge the gap between biblical history and modern genetics in book form. The conclusions are perhaps more tentative than the claims of the book indicate, so readers should be cautious about taking what is said as the final word. Much more work needs to be done to bring ancient DNA into the fold, and better mathematical models of human population and genetic history still need to be developed.
References and notes
- Jeanson, N.T., Traced: Human DNA’s big surprise, Master Books, Green Forest, AR, 2021. Return to text.
- Jeanson, N.T. and Holland, A.D., Evidence for a human Y chromosome molecular clock: pedigree-based mutation rates suggest a 4,500-year history for human paternal inheritance, ARJ 13:23–33, 2020. Return to text.
- Bergström, A. et al., Insights into human genetic variation and population history from 929 diverse genomes, Science 367(6484):eaay5012, 2020. Return to text.
- Mallik, S. et al., The Simons Genome Diversity Project: 300 genomes from 142 diverse populations, Nature 538:201–206, 2016. Return to text.
- Carter, R.W., Lee, S.S., and Sanford, J.C., An overview of the independent histories of the human Y chromosome and the human mitochondrial chromosome, 8th International Conference on Creationism, pp. 133–151, 2018. Return to text.
- Kaplanis, J. et al. Genetic and chemotherapeutic influences on germline hypermutation, Nature ǀ doi.org/10.1038/s41586-022-04712-2 Return to text.
- Carter, R.W., Patriarchal drive in the early post- Flood population, J. Creation 33(1):110–118, 2019; creation.com/patriarchal-drive. Return to text.
- Jónsson, H. et al., Parental influence on human germline de novo mutations in 1,548 trios from Iceland, Nature 549:519–522, 2017. Return to text.
- Crow, J.F., The origins, patterns and implications of human spontaneous mutation. Nat. Rev. Genet. 1:40–47, 2000. Return to text.
- Goriely, A. and Wilkie, A.O.M., Paternal age effect mutations and selfish spermatogonial selection: causes and consequences for human disease, Am. J. Hum. Genet. 90:175–200, 2012. Return to text.
- Sarfati, J., Why don’t we live as long as Methuselah? Creation 40(3):40–43, 2018. Return to text.
- Cf. Thomas, B. and Tomkins, J., How reliable are genomes from ancient DNA? J. Creation 28(3):92–98, 2014; creation.com/how-reliable-are-ancient-dna-genomes. Return to text.
- Ju, D. and Matheson, I., The evolution of skin pigmentation-associated variation in West Eurasia, PNAS 118(1):e2009227118, 2020. Return to text.
- Haak, W. et al., Massive migration from the steppe was a source for Indo-European languages in Europe, Nature 522:207–211, 2015. Return to text.
- Jensen, T.Z.T. et al., A 5,700-year-old human genome and oral microbiome from chewed birch pitch, Nat. Comm. 10:5520, 2019. Return to text.
- Rogers, A.R., Bohlender, R.J., and Huff, C.D., Early history of Neanderthals and Denisovans, PNAS 114(37):9859–9863, 2017. Return to text.
- Slon, V. et al., The genome of the offspring of a Neanderthal mother and a Denisovan father, Nature 561:113–116, 2018. Return to text.
- Larena, M. et al., Philippine Ayta possess the highest level of Denisovan ancestry in the world, Curr. Biol. 31:1–12, 2021. Return to text.
- C.f., Griffith, K. and White, D.K., An Upper Mesopotamian location for Babel, J. Creation 35(2):69–79, 2021. Return to text.
- Carter, R.W., The genetic history of the Israelite nation, J. Creation 32(1):114–120, 2018; creation. com/israelite-genetic-history. Return to text.
- Jeanson, N.T., Young-earth Y chromosome clocks confirm known post-Columbian Amerindian population history and suggest pre-Columbian population replacement in the Americas, ARJ 13:23–33, 2020. Return to text.
- Mendez, F.L., An African American paternal lineage adds an extremely ancient root to the human Y chromosome phylogenetic tree, Am. J. Hum. Genet. 92:454–459, 2013. Return to text.


Readers’ comments
Comments are automatically closed 14 days after publication.